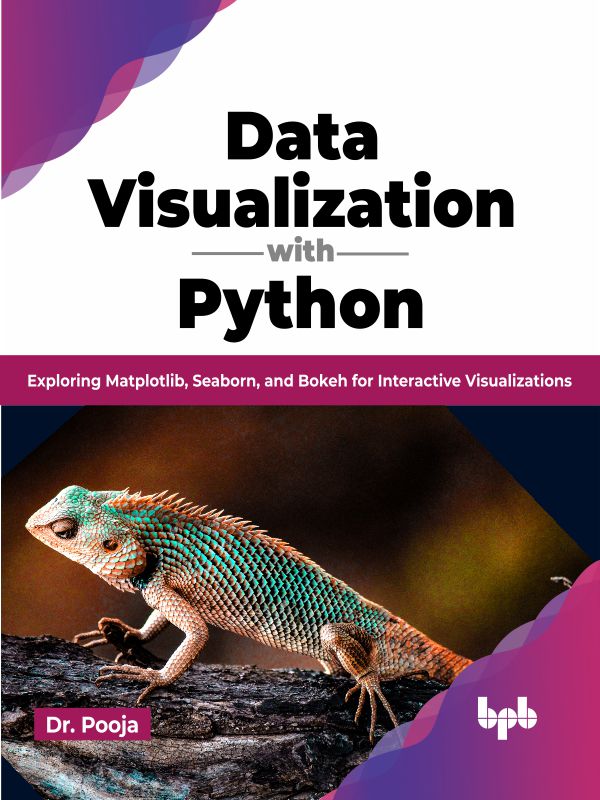
Data Visualization with Python

Dr. Pooja

SKU: 9789355515421

Rs. 719
Type:
Quantity:
FREE PREVIEW

ISBN: 9789355515384
eISBN: 9789355515421
Authors: Dr. Pooja
Rights: Worldwide
Publishing Date: 11th Jul 2023
Pages: 304
Dimension: 7.5*9.25 Inches
Book Type: Paperback

Python is a popular programming language for data visualization due to its rich ecosystem of libraries and tools. If you're interested in delving into data visualization in Python, this book is an excellent resource to begin your journey. 

With Matplotlib, you'll master the art of creating a wide range of charts, plots, and graphs. From basic line plots to complex 3D visualizations, you'll learn how to transform raw data into engaging visuals that tell compelling stories. Dive into Seaborn, a high-level library built on top of Matplotlib, and discover how to effortlessly create beautiful and informative statistical visualizations effortlessly. From heatmaps to distribution plots, you'll unleash the full potential of Seaborn in your data analysis endeavors.  Lastly, you will learn how to unleash the true potential of Bokeh and create compelling data visualizations that allow users to explore and interact with data dynamically.

By the end of the book, you will have acquired the knowledge and skills necessary to create a diverse range of visualizations proficiently.

KEY FEATURES  

  • Gain a comprehensive understanding of data visualization and exploratory data analysis (EDA) using Python.
  • Discover valuable insights and patterns in data through visual analysis.
  • Master the art of effectively communicating complex concepts by creating compelling and impactful data visualizations.

WHAT YOU WILL LEARN

  • Utilize Matplotlib, Seaborn, and Bokeh to produce visually captivating visualizations.
  • Gain expertise in various types of charts, plots, and graphs.
  • Craft visually appealing and informative statistical visualizations.
  • Construct interactive and adaptable plots using Bokeh.
  • Explore various techniques for conducting Exploratory Data Analysis (EDA).

WHO THIS BOOK IS FOR

This book caters to a wide audience, including undergraduate and postgraduate students, researchers, data managers, and data analysts. It presents an all-encompassing exploration of data visualization, equipping you with the essential groundwork to progress as a data-driven professional.

  1. Understanding Data
  2. Data Visualization – Importance
  3. Data Visualization Use Cases
  4. Data Visualization Tools and Techniques
  5. Data Visualization with Matplotlib
  6. Data Visualization with Seaborn
  7. Data Visualization with Bokeh
  8. Exploratory Data Analysis

Dr. Pooja is an accomplished individual with almost two decades of experience in imparting education and making significant contributions in the field of Computer Science and Engineering. With a strong background in education, she has dedicated her career to sharing knowledge and inspiring others through her expertise. She has delivered numerous hands-on training sessions to students/learners/industry personnel on Artificial Intelligence and Machine learning using Python. Furthermore, she has worked with NITTTR, Chandigarh, towards the co-creation and delivery of courses for the national online education portal “Swayam portal” (NPTEL) on “Smart grid analytics” implementing a “Machine Learning module.”

Throughout her professional journey, she has published over 90 publications, which include national and international journal/conference papers and book chapters, including IEEE, Springer conferences, and Scopus Indexed Journals. The extensive body of work reflects their commitment to advancing knowledge and making valuable contributions to the field of Artificial Intelligence/Machine Learning and Deep Learning. Her expertise and insights have likely been sought after by peers, students, and fellow researchers alike.

You may also like

Recently viewed